Well, it's happened again this year...
The pattern I showed consisted of strongly anomalous high pressure over Greenland surrounded by a ring of tendency to low pressure anomalies. I used NCEP/NCAR monthly analysis to examine it, source data. As with all atmospheric patterns, in some years it was stronger than others, and there was interannual variability in the details of the pattern, but taking a succession of years it was seen to be a common pattern. The robustness of this pattern and its unusual nature is highlighted by taking the average pressure fields for batches of years and subtracting one batch from another. The pattern of the post 2007 period survives this method, still being present for any 5 year period subtracted from the period 2007 to 2011. As could be seen from the original Summer Daze post, this process shows that the pattern doesn't occur regularly in the past in the way it has done since 2007.
This year the pattern is textbook perfect.
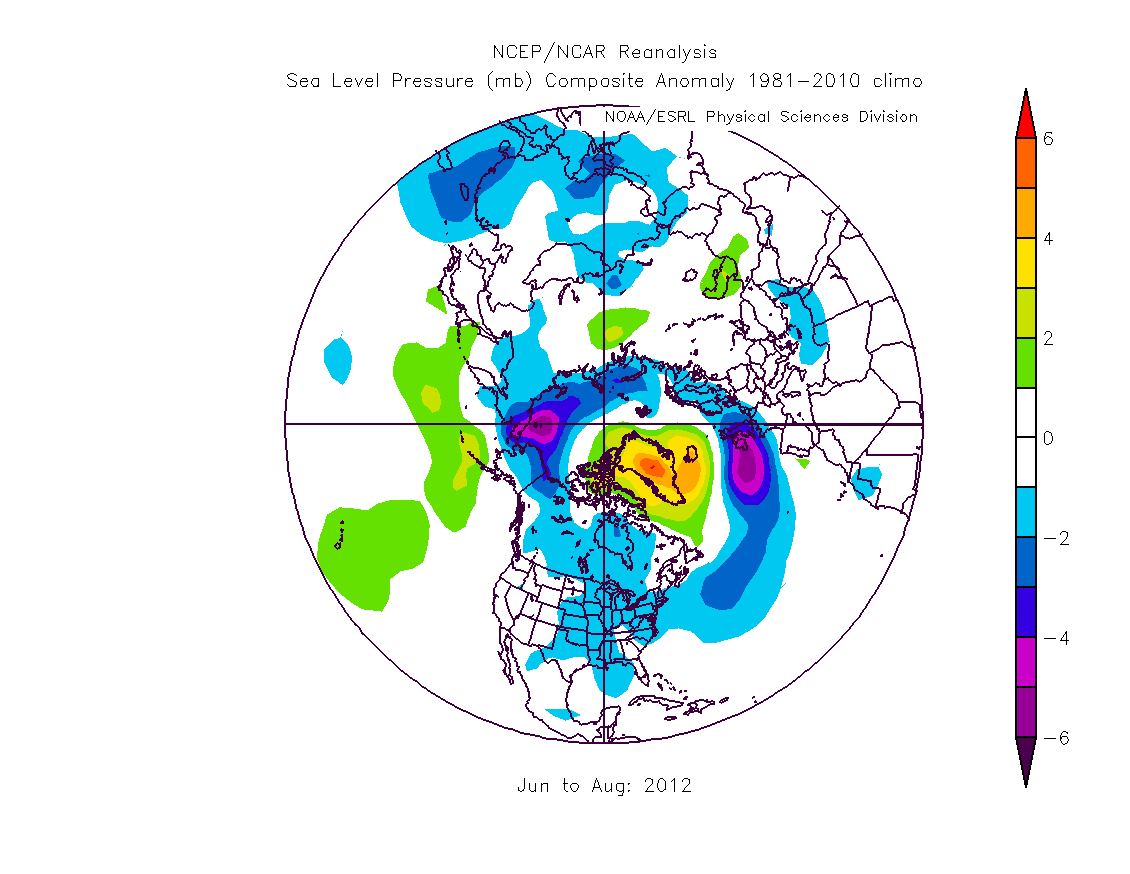
What spurred the original post was trying to figure out whether there was an impact on UK summer weather. The plot above shows purple over the UK, that's a negative deviation of pressure which is indicative of the low pressure dominated summer we've had this year.
And what have been the practical consequences of this low pressure dominate summer? The wettest summer in 100 years. Met Office. At this juncture it might seem reasonable to say I'm putting too much weight on just one year. But as I show in the original post, the above pattern holds, more or less, for every summer since 2007.
Then there's the Central England Temperature Series. This is the oldest instrumental temperature series in the world, more here, and I'm using it because I don't have access to series of UK average temperatures. However it serves its purpose.
I've used the seasonal average of maximum temperature, here, which is used because it's daytime maximum temperature (minimum is set in the night) that affects our perception of whether a summer is hot or cold. And it's my own anecdotal memory of summers since 2007 that I'm testing here, actually it's not just me - the idea of recent years cool wet summers seems to be gaining more traction in the UK. It's just that most people don't connect it with the Arctic.
So here is the CET series from 1975.
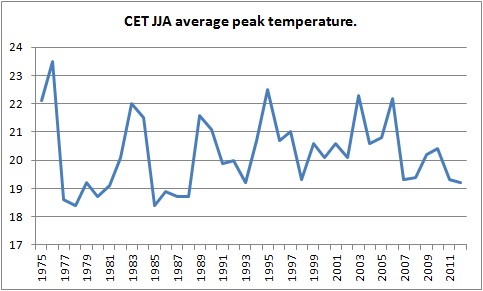
There's a gradual warming trend from 1975 to 2006 which drops off after 2007, this continues this year. Using the trend from 1975 to 2006 it's possible to work out the differences from the trend, known as residuals.

It's clear that there is a significant drop from the trend after 2007.
2012 continues all of this behaviour reinforcing an atmospheric pattern that has held since 2007. What's significant about 2007?
In 2007 the Arctic lost a quarter of it's area.

Source: Cryosphere Today.
2007 also saw a substantial loss of volume.
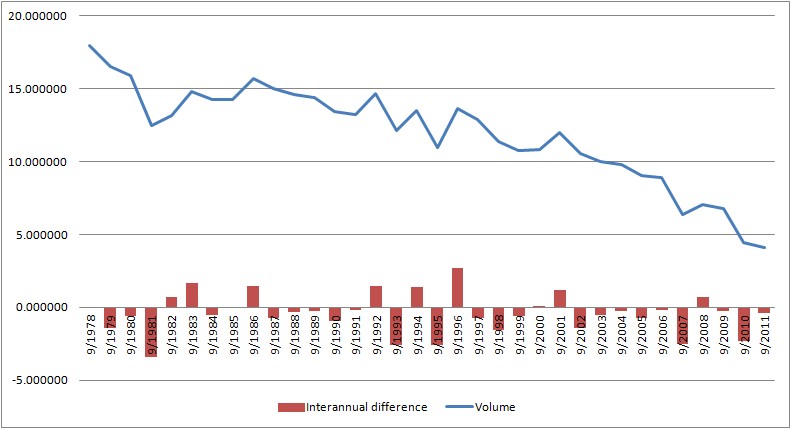
Source data: PIOMAS.
So...
In 2007 the Arctic suffered a massive loss of sea ice area and volume.
After that there was a largescale shift in Arctic atmospheric configuration.
At the same time there was also a succession of cool, damp, low pressure dominated summers for the UK.
Is this a coincidence? Is it F...
28 comments:
I suspect this is explained by Wayne Davidson's recent comment over at Neven's
Kevin,
Thanks. I know a lot more now but can't say until the research is published (not my research). Sorry.
This is big!
Hi
a very quick question - just something thst struck my imagination when I saw your Fig. 1, the reanalysis: Could one describe this as that Greenland takes up the role that the whole Arctic used to play, a central cold High with a surrounding low P belt that used to in former times surround the whole Arctic but no longer does, as substantial parts of the Arctic Ocean are no longer perenially ice covered? Only Greenland is?
Does that make sense as a way to see it?
time starved, will think more about it, thanks for your blog!
Actually thinking about it, I can say this.
Hanna et al, 2012, "The influence of North Atlantic atmospheric and oceanic forcing effects on 1900–2010 Greenland summer climate and ice melt/runoff."
http://onlinelibrary.wiley.com/doi/10.1002/joc.3475/abstract
From the abstract.
"Moreover, the four recent warm summers of 2007–2010 are characterised by unprecedented high pressure (since at least 1948—the start of the NCEP/NCAR reanalysis record) in the tropospheric column."
That paper points out that it is not proper to use SLP when looking at Greenland, in my defence I would say that I'd started out last year not intending to look at Greenland, and anyway in the proper metric geopotential height, the pattern is still there, and is as robust. Table V of Hanna et al shows the post 2007 as consitently the highest Greenland blocking Index at 700, 500 and 300 hPa - apart from 2010, and...
If you click on the first link of the above post - to the original Summer Daze post - then scroll down to the sequence of summer SLPs for various years... You'll find that the pattern I identified is muted, if present at all, in 2010.
2010 was the year of the last crash. Is there a connection?
Hanna et al show that the pattern I've been going on about in these Summer Daze posts is related to the large Greenland run offs we've seen since 2007. So it's not as simple as blaming the warming: There has been a massive shift in the Arctic atmosphere caused by the larger areas of open water post 2007.
Anyone who's dismissive of what's going on in the Arctic really hasn't got a clue about what's happening.
Hi Marsanges,
This is essentially what Wayne Davidson is saying, see top comment from Kevin.
My answer - not really.
There wasn't a high pressure anomaly of the same sort sitting over the pole pre 2007 that then moved over Greenland. That's essentially my problem with this view.
What Hanna et al outline is a complex situation in which Rossby waves of the right wavelength set up standing waves that cause a stationary blocking high over Greenland. However I'm still trying to get my head around how they're counting wavenumbers, as I don't see the number of cycles around the Arctic that they state. I guarantee it'll be me that's wrong.
In the end though it also answers the question about what causes the wet UK summers and ties in with Dr Francis's research into jetstream rossby wave slowing due to Arctic warming. The whole pole equator gradient was screwed up by the post 2007 warming, notably ocean surface warming in the Arctic basin. This is changing NH circulation.
Got it.
Counting Rosby Wave number on this page:
http://www.meteor.iastate.edu/classes/mt454/WavesProject/Wave_analysis.html
That method works.
This Greenland centred anomaly is really fascinating. I meant to have an evening off watching a film. But ended up examining these anomalies using 500mb means and anomalies.
Basically what's happening is that as you get closer to the Arctic basin the geopotential heights (GPH) go down, OK so far - the air over the pole is colder and denser so the top of atmosphere is closer to sea level than in mid latitudes, TOA is at max in the equatorial regions.
The jet stream forms at the boundary between cold Arctic air and warmer mid latitude air. When you plot GPH as mean for JJA you can see the rough trajectory of the jet by following the curves of the boundaries between different layers of GPH.
This high pressure anomaly over Greenland is actually the result of a GPH ridge extending northwards from the mid latitudes, Due to the dominant wavenumber of the rossby waves, wavelength and speed, they set up a semi permanent standing wave that creates this ridge over Greenland.
This is exactly what Dr Francis was talking about in her paper on patterns in the jet stream getting stuck! The relevant pattern of the jetstream is even printed in one of the figures.
And I didn't think to connect the two patterns.
Stupid!
Hi
you might like this bbc news story:
http://www.bbc.co.uk/news/world-europe-19508906
it shows the ECMWF director (?) standing in front of just the same (appearance of) anomaly plot as your Fig 1. I´d have loved to be there to hear what he actually did say. Unfortunately, from the BBC article it isnt really recognizable very much beyond platitudes ("we´re researching it" ).
Yes, I noticed it too. It was on News 24 earlier today. Didn't catch who the scientist was though.
Thanks for making sure I was aware.
well, well! I located a video from this guy explaining the figure (and others). It is here:
http://www.research-europe.com/index.php/2011/08/professor-alan-thorpe-director-general-european-centre-for-medium-range-weather-forecasts/
Dont expect too much though. He has so much cut it down on specifics for the reporter that it doent really answer your questions (Is this new pattern * a standing Rossby wave? * a shifted Cold Pole a la Wayne? * an expression of the AO and thus not really new?) What he does mention though is an increase in north atlantic water temperatures as another causative factor. For that I found a nice presentation at
http://www.eu-thor.eu/index.php?eID=tx_nawsecuredl&u=0&file=fileadmin/user_upload/thor/template/Posters_and_presentations/IPYJonsson-presentation1.ppt&t=1347145551&hash=89a1bc34782e3afb7b6bb1bab8498f3e5479a77d
(achtung, directly targets a powerpoint download)
but that is probably well OT now.
Have a good night. Thanks again for the blogs and thanks to the scientists for making their materials available on the net.
Chris
Great stuff as usual but why is there this moan from the UK media (and Met Office) about our wet summers when the US and Russian cereal production is under threat from drought.
I can buy a Chinese umbrella at Poundland but the poor of the world are priced out of the food market, which reacts strongly to modest falls in production.
Where can I go to find such concentrated information as yours from reliable amateur (i.e. trusted and caring) sources on (for example) the effects of climate change on world food production?
It's just so hard to keep enough in mind - given the imperfect sources - for even caring, dedicated people to make rational judgments about the state of the world. The 9 to 5 policy makers and many prominent academics are way behind.
Thanks for you insights. The same goes for Neven (and colleagues), Tamino and others.
Thanks Marsanges,
The link to the BBC video is here:
http://www.bbc.co.uk/news/world-europe-19508906
You inadvertently linked to a page about Prof Alan Thorpe. Thanks for finding out who it was, without that it would have taken me ages to find the video.
The SST issue is interesting, the Hanna paper may be able to throw light on that, but this whole matter may warrant a new blog post.
On balance I don't think SST is the killer factor, because it's after 2007, with the ice loss, that we see the Greenland blocking anomaly become a regular event. And as the Jonsson slides you linked to (thanks) show, Atlantic Water influx doesn't suggest a warming around that time - but do SSTs elsewhere?
2007's ice loss was initiated by an early dipole anomaly - could there be a linkage to SST in the N Atlantic? I've never seen evidence for it.
Chris, you are on a roll, my friend. I, of course, am linking to this one as well: Signs of Arctic climate change
Geoff,
As you've seen I keep my eye on drought. Stuart Stanniford covers issues like food prices, although I don't follow him as much as I'd like (time, time, time). You'll find a link to his Early Warning blog on my blog roll. For example here's his posts tagged 'corn'.
http://earlywarn.blogspot.co.uk/search/label/corn
Scroll down to Long Term Crop Prices, that seems to confirm my suspicion that the greatest base food stock prices seem to follow oil prices, and that the signal of AGW on yield is not yet strong. Although it does only have to be marginal to affect those living on the margin of affordability.
However what Hansen's Climate Dice and Dai's work shows is that this will become a massive problem later this century.
Thanks Neven,
I think I mean thanks....
I feel like Shrek, I've got got this quiet backwater of the internet, a swampy morass of often impenetrably technical posts. And here you come sending the whole of the amateur-arctic-enthusiast fairytale cast tramping all over the place.
;)
Chris
Are you using actual temperatures or the temperature anomaly (base 1951-1991) as is commonly used? Would the CET continue to show a cooling trend post 2007 in that case?
MMGhosh,
IN the CET absolute temperatures are used, not anomalies. The use of anomalies simply has the effect of moving the zero datum, so yes, a relative change like a reduction in temperature would still be evident if anomalies were used.
You can think of the residuals as anomalies from the trend.
Chris
Thanks for pointing me to an excellent resource.
There are so many relevant variables in climate/food discussions. e.g.
1. World population.
2. The resource intensity of diets.
3. Greenhouse gas emissions from agriculture
4. The price of oil.
These and more interact with each other so it's difficult to attribute causal links. Although I believe "climate change causes droughts, floods and starvation", it's an arguable point.
One lesson from the past month is surely that climate change is much worse than AR4 predicted and worse than even the CMIP5 models for AR5 predict.
I think the postings on earlywarn.blogspot.co.uk do not sufficiently take account of this.
I don't think they factor in Rossby waves and the ideas put forward by Jennifer Francis and others. (My search of their site didn't work well, partly because of their robots.txt)
Would you argue against Oxfam's "Sudden spikes in global food prices to 'become the norm'"?
Geoff,
"I don't think they factor in Rossby waves and the ideas put forward by Jennifer Francis and others."
That's an interesting issue. I'm not sure how GCMs handle issues like this, they do produce things like the Jetstream, but I've never read how well.
That said, that the ice recession is so far ahead of the GCMs would imply that the GCMs are behind on projecting mid latitude impacts.
The Independent article you link to is interesting. It states:
"The statement from the Rome-based Food and Agriculture Organisation (FAO), the International Fund for Agricultural Development (IFAD) and the World Food Programme (WFP) said that weather had been the driver of each three international food spikes in the past five years."
Now that I didn't know.
However I do disagree with this:
"Food price spikes caused by extreme weather events like the
US drought will become the norm over the next twenty years, leading to millions of deaths from malnutrition among the world’s poorest if Governments do not act on climate change, Oxfam has warned."
It is impossible to stop what is coming over the next 20 years. Perhaps a total cessation of fossil fuel emissions might have an impact on such a short timescale. But the results of thaat 'medicine' would be worse than the 'disease'.
Whatever we do we are stuck with the current trajectory for decades: As the Arctic continues towards a seasonally sea ice free state - which I hope is a steady equilibrium, not the start of more rapid recession eating into winter. And as the oceans warm taking us closer to the equilibrium global average temperature we have 'earned' as a result (mainly) of CO2 emissions thus far.
This is a troubling development. Current projections of Greenland ice sheet loss assumed that increased precipitation would partially offset increased melting due to rising temperatures. The presence of semi-permanent summertime high pressure over the Greenland summit, however, would promote sinking air and reduced moisture/precipitation over the ice sheet. I'm not sure if potential increased wintertime precipitation would be enough to compensate for decreased summertime precipitation. Although I'm not sure, I would assume the winter is the dry season there with the air being too cold and dry to support snowfall. I guess you can throw out any existing calculations on the Greenland ice sheet mass balance. The models have consistently underestimated the speed of changes in the Arctic. It's starting to become apparent that even temperatures sustained at today's levels, on the long run, would result in a seasonal (perhaps year-round) ice-free Arctic Ocean and little, if any, glacial ice over the Greenland subcontinent.
Ohioclimate,
Sorry for not replying. I've been rather busy and clean forgot.
It's a very complex picture and we'll have to see what research is published on this matter, and what light it throws on the loss of Arctic sea ice.
If not I realize and could not do it without having your tolerance . I change accumulation scarred this article to sound and gauzy calculate intended for remark. Anyway realize it either way!
Uh huh.
I´ll say nothing of the sort .. just wanted to bring a paper to CR´s attention (if not already seen),
GEOPHYSICAL RESEARCH LETTERS, VOL. 39, L02707, 6 PP., 2012
doi:10.1029/2011GL050486
Atmospheric response to the extreme Arctic sea ice conditions in 2007
... "A pronounced low sea level pressure anomaly over the Eastern Arctic (−200 Pa) reinforces a sea level pressure dipole over the Arctic that has been observed to become an increasingly important feature of the Arctic atmospheric circulation in summer. The anomalous pressure distribution contributes to sea ice transport from the Eastern Arctic and is likely to reinforce the original sea ice extent anomaly." ...
I believe they´re writing about just this anomaly that you described here.
Marsanges,
We're thinking along the same lines.
That paper, Bluthgen et al, is one that's come to mind about this issue. I'll be mentioning it in a blog post series I'm writing on new resarch about this pattern.
But the new research shows the pattern starts with a high over Greenland, whereas Bluthgen et al talk about sea ice anomalies in the Siberian sector reinforcing the low pressure there.
I'll be posting a new post later today.
F&E,
Thanks for the (somewhat generic) comment. Feel free to post again without the advertising links.
This is very anecdotal but 2007 is the year I was forced to stop breeding Amorphophallus plants here in western Europe. They're tuberous plants that send up a single showy leaf. But this leaf takes up a lot of space, so I used to move them outside in summer. Until 2007, too much wind, lots of plants knocked over. Same thing in the following years, had to stop breeding them.
Thing is, when the strong wind start again here in summer and I tell people that this started in 2007 the only responses I get are shrugged shoulders.
Thanks Anon,
Do you mean 'After' rather than 'Until 2007'?
Windier summers would be a tendency of the increased tendency to low pressure. As low pressure systems are events that move over the small magnitude of the low pressure anomaly over the UK post 2007 may not seem to reflect the apparent increase in storminess. It would be interesting to see someone more capable than I do a study of storm frequency and intensity.
By the way, an anecdote that fits with wider observations supported by published science arguably becomes supporting evidence. :)
hi
the bat seems to have eaten a reply to your question:
\It would be interesting to see someone more capable than I do a study of storm frequency and intensity.\
A conference called 3ICESM has done just that, just now in Hamburg:
" However, in contrast to storm tracks in other regions, the North Atlantic storm track responds [to GHG forcing] by strengthening and extending farther east, in particular on its southern flank. These adjustments are associated with an intensification
and extension of the eddy-driven jet towards western Europe and are expected to have considerable societal impacts related to a rise in storminess in Europe. ..."
T Woolings et al,
http://meetingorganizer.copernicus.org/3ICESM/3ICESM-65.pdf
a collaboration of Univ of Reading and Univ of Koeln, Germany.
Post a Comment