2007 arguably marks a new era in the Arctic, that year being the year of massive sea-ice loss in the Arctic from which the Arctic has not recovered, and may be the start of a period of accelerated loss of sea-ice. So it makes sense to examine what impact, if any, this has had on methane emissions. The AIRS images only run from 2003, so any suggestion of trend or changes pre and post 2007 doesn't come with high certainty, especially as some months are very variable from year to year. However patterns can be seen. Note that when I talk about before and after 2007 the demarcation is actually September 2007, so for example after August 2007 starts from August 2008.
January, February, March, April, September, October, and November all show strong indications of increased methane after 2007. December doesn't seem to, but the image for December 2011 has only just been released and as of the time of posting I haven't yet managed to get the image to open, image available here. June shows a pre and post 2007 difference, but from 2008 the increased methane is often extensive south of the 60th parallel. This is also a feature of some of the cold season months listed above, for example February has most of the increased CH4 below the 60th parallel in the mid latitudes. So whilst simplistically it may seem easy to link the post 2007 methane increase with the Arctic sea-ice loss, closer examination shows that this link may not be so simple.
The other interesting factor is that the methane levels are higher during the cold months and lower during the warm, this is contrary to what might be suspected. Pickett-Heaps et al find that for the monitoring site at Alert, methane levels are strongly seasonal with a low in the summer months and a high during the winter. Yet seasonal emissions from the Hudson Bay Lowland show up at Fraserdale as a peak during the summer, this is common to other studies. It is stated in that paper that the summer minimum of methane at alert is due to "...chemical loss in the Northern Hemisphere." So it would seem that whilst peak emissions are in the summer that is also the time of peak methane destruction, that destruction process being muted in the winter due to the cold conditions in the Arctic. Emissions of methane in the Arctic during winter are not negligible but are considerably smaller than during the summer, e.g. Whalen & Reeburgh.
There are indications of the pattern of permafrost distribution around the Arctic being reflected in the pattern of methane concentration. For example in March and April this pattern is apparent both before and after 2007. Dr Yurganov presents such a correlation in his presentation for the London Symposium. The areas of permafrost are shown in red.

Page 15 of Yurganov presentation.
It would be interesting to see the results of analysing this data using empirical orthogonal functions analysis using the distribution of permafrost as a loading pattern - although there's no way I'm up to something so complex. I wonder if a time series index similar to the Arctic Oscillation or Arctic Dipole time series could be made. It's perhaps too early for robust patterns to show up (short dataset), but this could be useful as time proceeds. However perhaps more striking are some smaller localised patterns.
A striking detail is the presence of certain 'hotspots', two of the most confined and distinctive of the persistent patterns are to the east of the Lena River in Siberia (from the Arctic coast inland along the 130 degrees East longitude line) and in the Yukon (West of the Canada/Alaska border between 130 and 140 degrees West). After an unsuccessful search on Google I've posted a question at The Oil Drum asking if there are any oil/gas installations in these areas but so far have only one reply, not stating that there are such installations in that area. It seems unlikely that such installations would emit enough to give such large anomalies but I thought it work checking. If indeed these anomalies are associated with underlying surface sources from wetland or permafrost, and I can't think of another explanation, then this suggests that AIRS should be capable of tracking the development of localised ground sources. The images are developed from AIRS retrievals at 400mb height, and AIRS has a maximum sensitivity at 200mb however as Dr Yurganov argues AIRS is still useful in a qualitative sense for lower altitudes (Yurganov presentation pages 9 & 10).
The research at the forefront of much discussion about Arctic methane is that by Semiletov and Shakhova. In terms of their work on the East Siberian shelf the question arises: Do the AIRS images reveal anything about possible marine sediment methane clathrate decomposition? The localised anomalies discussed above suggest that such an observation should be feasible in principle. Inspection of the videos reveals persistent cold season areas of higher concentration around the New Siberia Islands and the Laptev Sea, how do these tally with Shakhova and Semiletov's work?
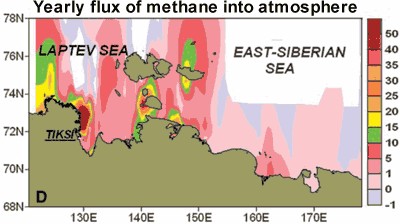
Shakhova et al found that there was extensive outgassing from the East Siberian Shelf. The following graphic is from their 2010 paper showing ocean emissions to the atmosphere.
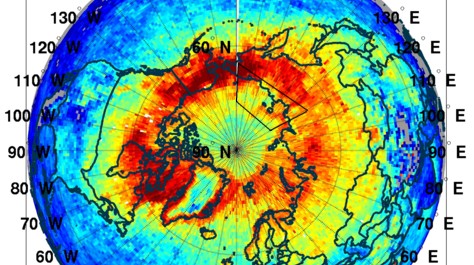
Yurganov's images from AIRS do show a persistent methane anomaly in that area, here for illustration is March 2011, however the anomaly is visible during most of the winter months.
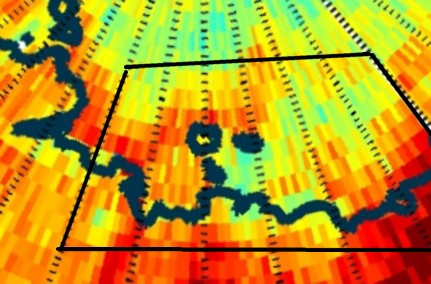
The black lines show roughly the area of the Shakhova et al figure, the whole Arctic is shown here with that box for orientation.
So the methane anomaly that is being attributed to marine clathrates is apparent in AIRS, although using the admittedly clumsy technique of viewing a short series of images there isn't a suggestion of intensification with time. These images do seem to better support increases of methane emission from wetlands and permafrost, which is supported by other research. However if Shakhova and Semiletov's work is to interpreted as the early signs of a developing decomposition of marine sediment methane clathrates then AIRS seems to have the potential to highlight activity remotely and perhaps assist in directing field research to the right areas, both on land and in the sea.
I discuss this matter further in light of comments from Dr Yurganov about this post, here.
Pickett-Heaps et al, 2011, Magnitude and seasonality of wetland methane emissions from the Hudson Bay Lowlands (Canada).
http://www.atmos-chem-phys-discuss.net/10/22415/2010/acpd-10-22415-2010-print.pdf
Shakhova et al, 2010, Extensive Methane Venting to the Atmosphere from Sediments of the East Siberian Arctic Shelf.
http://www.sciencemag.org/content/327/5970/1246.abstract
Whalen & Reeburgh, 1988, A methane flux time series for tundra environments.
http://www.agu.org/pubs/crossref/1988/GB002i004p00399.shtml
Yurganov Presentation.
ftp://asl.umbc.edu/pub/yurganov/methane/Yurganov_LondonCH4.pdf
12 comments:
I came across someone else's reposting elsewhere of some of the AIRS info -- making much of the big swatches of red color on the images and claiming it might be a methane blowout event -- so I followed up out of curiousity by using the contact link at one of the AIRS websites, where they invite questions.
This is the reply, in full:
—————- begin quote
Color bars are very nonlinear, and the eye can be easily fooled. The comment you quote is reading too much into that image.
That commenter should also view this image of the trend over the
Arctic cap:
ftp://asl.umbc.edu/pub/yurganov/methane/70-90N_VMR_CH4.jpg
The early monitoring of CH4 had shown a small trend upward that
stopped around 2000, for no known reason. Then the trend may have
begun again around 2008. Looking at the trend plot, there is a very
small increase since 2008. The variability is larger by a factor of
five, and there was a large excursion in mid-2011 that reached the
level last seen in mid-2003.
——— end quote
Thanks Hank,
I'm intrigued as to where those claims of imminent disaster were being made.
I take it the official response you quote is about the 'doomer'.
I asked the AIRS folks after I saw the images mentioned by someone in a comment in one of the recent RC threads on methane -- since then I've seen them pop up from commenters elsewhere as well, often claiming a methane blowout scenario.
I'd guess it's from an effort to promote "relieving the pressure" by drilling for natural gas around the Arctic, by calling it geo-engineering. (Promoters seem to like the hyphen.)
The Arctic Methane Emergency Group seems to have a geo-engineering element within it. What I've seen over at RC are doomers - people who for their own reasons have tagged onto Arctic methane as a mechanism for catastrophe and are tackling the issue in a mirror image of the deniers - start with what you want to see then go out and look for the evidence.
I'm not saying it can't be very dangerous, but given the uncertainties, why concentrate exclusively on worst case scenarios?
As for geo-engineering, I once knew an old lady who swallowed a fly...
The pairs of AIRS images are back again this month:
http://www.realclimate.org/index.php/archives/2012/02/unforced-variations-february-2012/comment-page-5/#comment-227576
The regrettable pseudoscience site "Huffington Post" site is quoted pushing the geoengineering PR methane stuff, too.
If people directly ask the scientists -- as I did -- they get the facts without the spin.
Thanks Hank,
Steve Bloom had made me aware of that, I had a quick look at RC and found Wili's comment - oops - now I see it was a different comment by Wili! It really irks me that they hide behind words "...should we be worried yet?" When it's obvious what they're getting at.
Why not just come out and say it?
Because they know they're on shakey ground.
So why say it at all?
[Bangs head against desk.]
Kudos to you for continuing the argument I walked away from at RC. I found it all too reminiscent of dealing with sceptics. In fact, yet again I've delayed posting my last post on Arctic methane because the ending keeps descending into a broadside against the 'imminent catastrophe' doomers. And I don't think that's productive.
Looked recently? arctic-news.blogspot.com/search/label/methane
No Hank, I've been to busy for months.
Dr Yurganov changed the basis of his monthly plots and I've not even got round to updating the videos I did, they need reworking from scratch.
What is shown at the link you gave isn't surprising. The disagreement I have with Sam Camara and the AMEG is over timescale - I think the methane driven catastrophe will unfold over many centuries to millennia, not decades. I expect that analysis of dC13 will show isotopically light CH4 from the north has increased further to what I calculated a couple of years ago. graphic
This is just the start of an event that will probably rival the PETM and because there will be no Azolla Event may rival the End Permian.
Bit by bit I'm reading about other CH4 involvement in climate. It seems it may have played a more active role in the Quarternary. And I've already read about hyperthermals in the Eocene. The question is what made the PETM and End Permian such extreme CH4 events, and are there other such events not so popular in the literature and public consciousness?
> The disagreement I have with Sam
> Camara and the AMEG is over
> timescale - ... centuries to
> millennia, not decades.
No argument there. Fractalplanet (Scott Johnson) is covering this well also.
> I expect that analysis of dC13
> will show isotopically light CH4
Still looking for more on all of this, just checking back. Pointer welcome if you have written more elsewhere.
Hank,
I have previously (years ago) done a plot of 13C in methane before, IIRC it showed strong decrease further north (it was in latitude bands). Can't find it now but if you need I can revisit the issue and update.
Don't "need" it, just a curious bystander trying to follow what's happening. Might be of interest over at Scott Johnson's thread, most recently
https://fractalplanet.wordpress.com/2015/01/08/once-more-mcphersons-methane-catastrophe/
I'll have a look for the source data, which I couldn't find recently.
I did go over and read that post of Scott's. The plot you were asking about is a Hovmoller plot.
Post a Comment